2025 Colorado Car Crash Data and Statistics
Denver’s roads present unique challenges for motorists navigating our city’s growing population, evolving infrastructure, and variable mountain weather conditions. At McQuaid Injury Law, we’ve witnessed firsthand how traffic patterns affect our clients’ lives and safety. This comprehensive analysis examines the latest 2025 Colorado road safety data, revealing concerning trends and potential solutions for our community.
Our legal team has spent decades representing Denver residents affected by traffic accidents. This experience and current statistical analysis provide valuable insights into accident hotspots, common causes, and emerging safety concerns across Colorado’s roadways. Understanding these patterns could help you and your loved ones stay safer on the road, whether you’re a daily commuter, occasional driver, or concerned citizen.
Join us as we explore what the numbers reveal about our changing traffic landscape and discover how this knowledge can inform safer driving practices and potentially life-saving policy changes for all Coloradans.
Colorado Traffic Crash Analysis 2025
Our data team analyzed car crash data from the Colorado Department of Transportation (CDOT) for the first quarter 2025. Our findings are as follows.
Key Insights
- Rush Hour Danger Zone: The afternoon rush hour period (3-6 PM) accounts for a significant portion of crashes, with Thursday showing the highest concentration.
- Morning Commute Risks: Weekday mornings between 7-9 AM show a dramatic spike in crashes as Coloradans head to work.
- Weekend Patterns: Weekend crash patterns differ significantly, with more evenly distributed crashes throughout the day and continued activity into late evening hours.
- Safest Time to Drive: Early weekday mornings (2-5 AM) consistently show the lowest crash rates across all days.
- Thursday Phenomenon: Thursday afternoons have the highest single-hour crash count, particularly at 4 PM.
The data set we analyzed from 1/1/25 to 3/31/25
Total Crashes
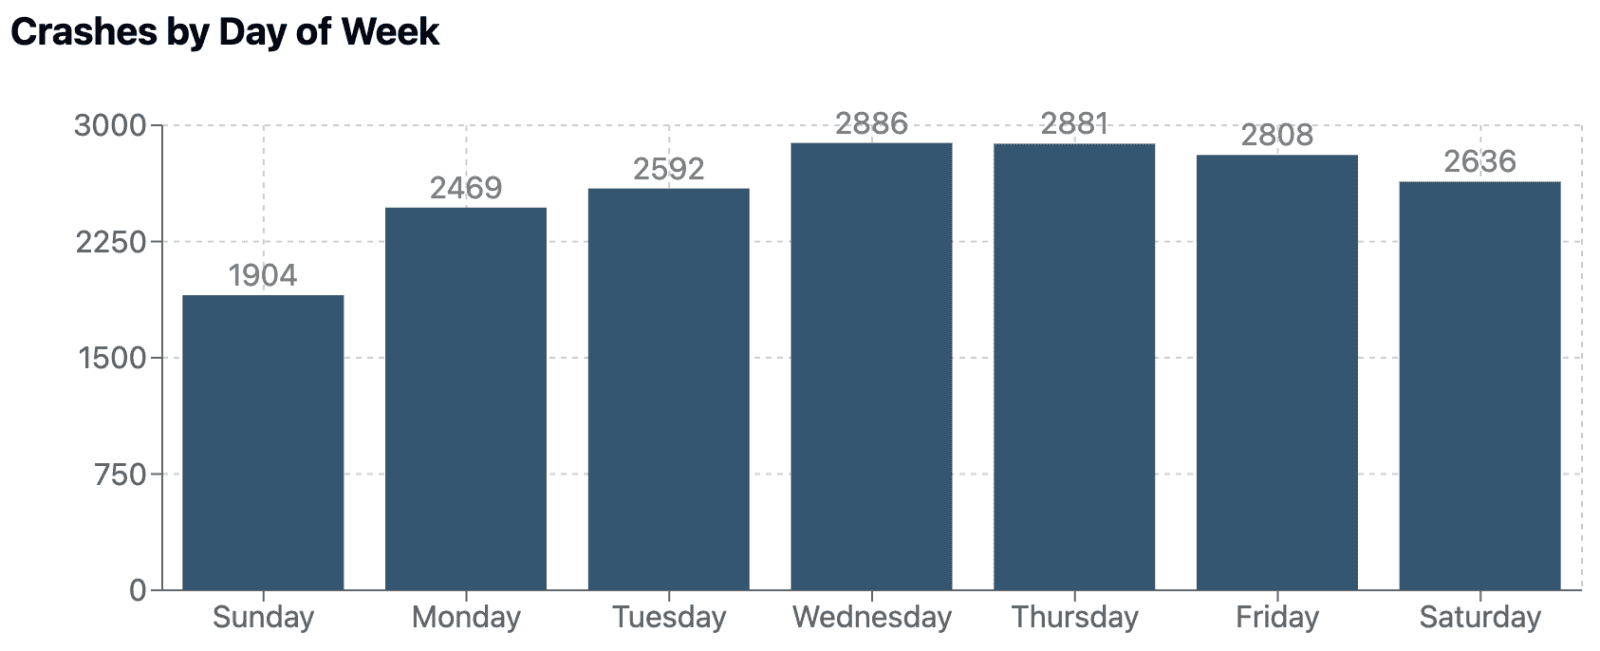
Wednesday
2,886
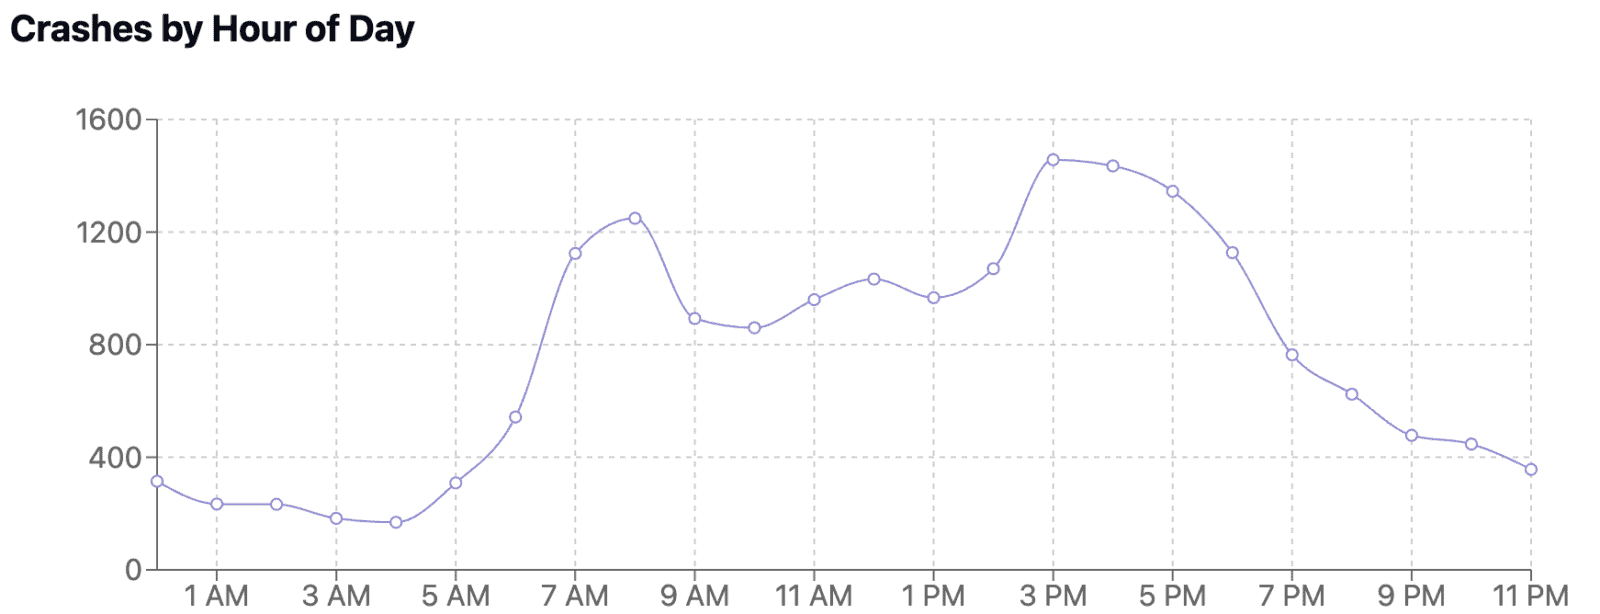
3 PM
1,457
Weekday vs Weekend
Weekend vs. Weekday Distributions
Weekend crash patterns differ significantly from weekdays:
- Weekends show more evenly distributed crashes throughout the day
- Saturday and Sunday maintain higher crash rates into late evening hours
- Weekend mornings experience fewer early crashes compared to weekday commute hours
Critical Times
5,364 crashes
1,443 crashes
Rush Hour Danger Zones
The afternoon rush hour (3-6 PM) stands out as particularly hazardous, accounting for 20.4% of all crashes. Thursday afternoons show the highest concentration, with a remarkable 280 crashes occurring during the 4 PM hour alone—the single highest hourly count in the entire dataset.
Day of Week Patterns
Thursday emerges as the most crash-prone day with over 2,500 incidents, followed closely by Wednesday. This midweek concentration suggests driver fatigue may be a contributing factor as the work week progresses.
Morning Commute Risks
Weekday mornings between 7-9 AM demonstrate a dramatic spike in crash incidents as commuters head to work. Wednesday at 8 AM records 252 crashes, highlighting the morning commute as a critical safety concern.
Safest Driving Times
Early weekday mornings (2-5 AM) consistently show the lowest crash rates across all days, with Tuesday at 2 AM recording just 8 incidents—the lowest hourly count in the dataset.
Crash Analysis by County
Understanding crash distribution across Colorado’s 64 counties.
Key Insights
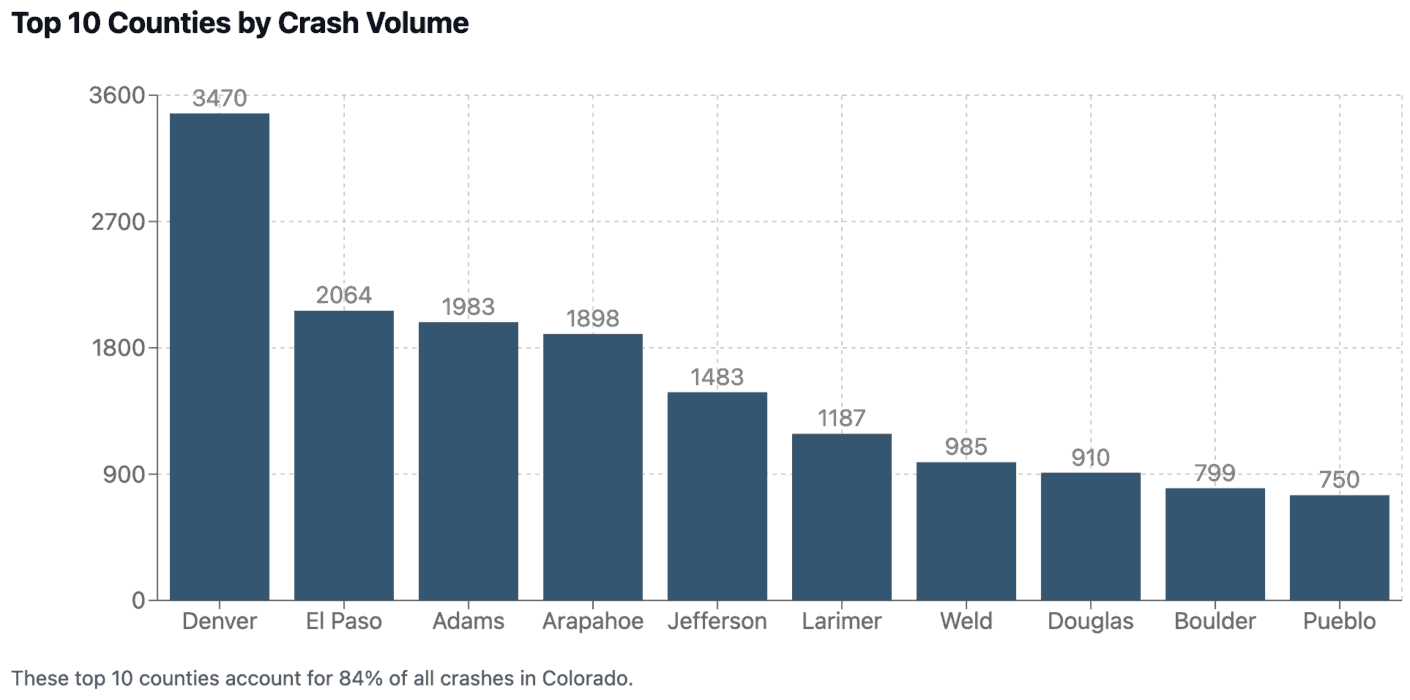
- Urban Concentration: The top 5 counties (Denver, El Paso, Adams, Arapahoe, and Jefferson) account for over 50% of all crashes in Colorado despite representing only 8% of counties.
- Metro vs. Rural Disparity: Metro counties experience significantly more crashes than rural counties, highlighting the impact of population density and traffic volume on crash frequency.
- Population-Adjusted Risk: When adjusted for population, some counties show unexpectedly high crash rates, suggesting factors beyond population size affect crash risk.
- County Size Distribution: Most Colorado counties (over 60%) experience fewer than 50 crashes, indicating crash incidents are heavily concentrated in a small number of counties.
- Geographic Patterns: Front Range urban corridor counties consistently show the highest crash volumes, while remote mountain and plains counties report minimal crash incidents.
DENVER
3,470
87%
Crashes occur in metro counties
Metro vs. Rural Counties
The contrast between metropolitan and rural counties is stark. The 12 metro counties experience approximately 87% of all crashes, while the remaining 52 rural counties account for only 13%. This highlights how population density and traffic volume directly correlate with crash frequency.
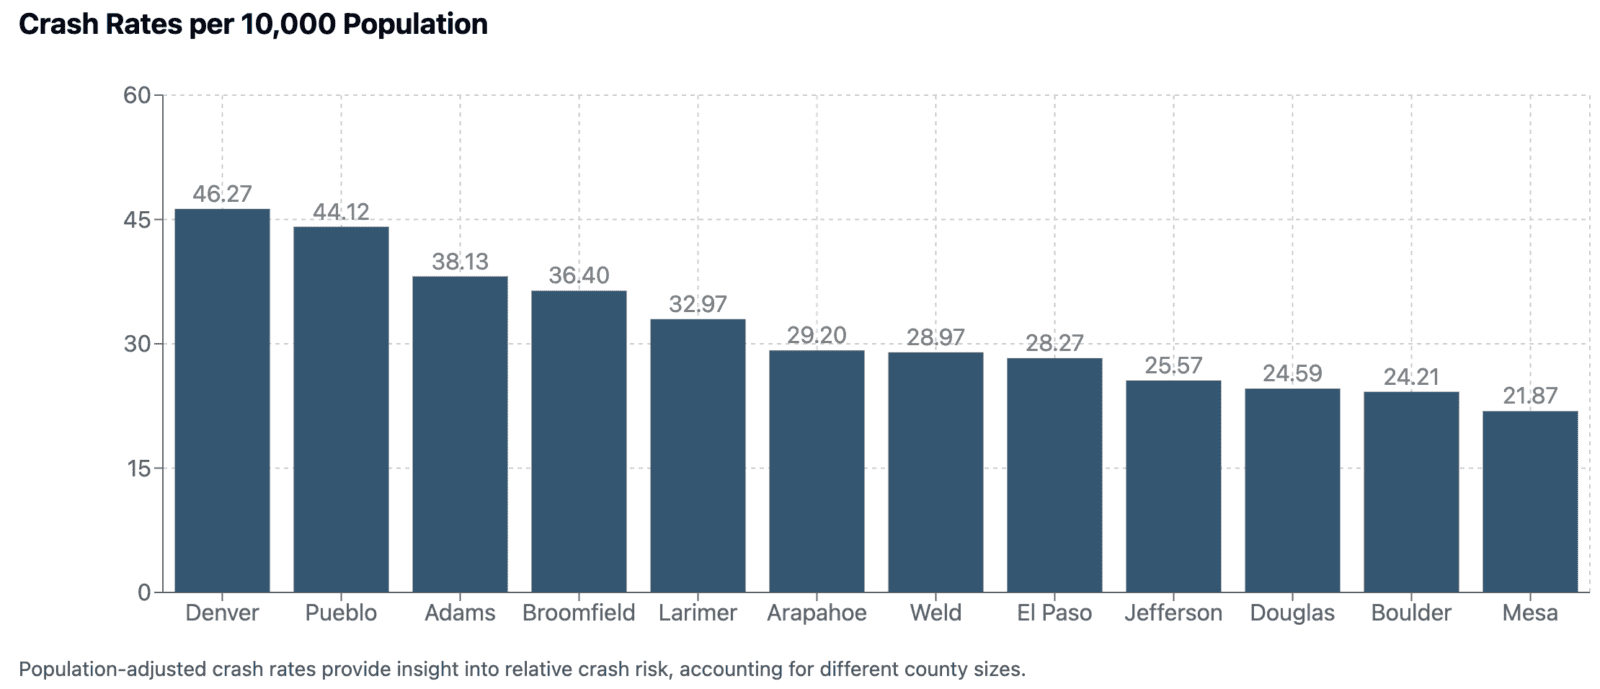
Population-Adjusted Risk
When analyzing crashes relative to population size, some interesting patterns emerge. While Denver has the highest absolute number of crashes, other counties may show higher crash rates per 10,000 residents, suggesting local factors beyond just population size affect crash risk—including tourism, through traffic, road design, and weather conditions.
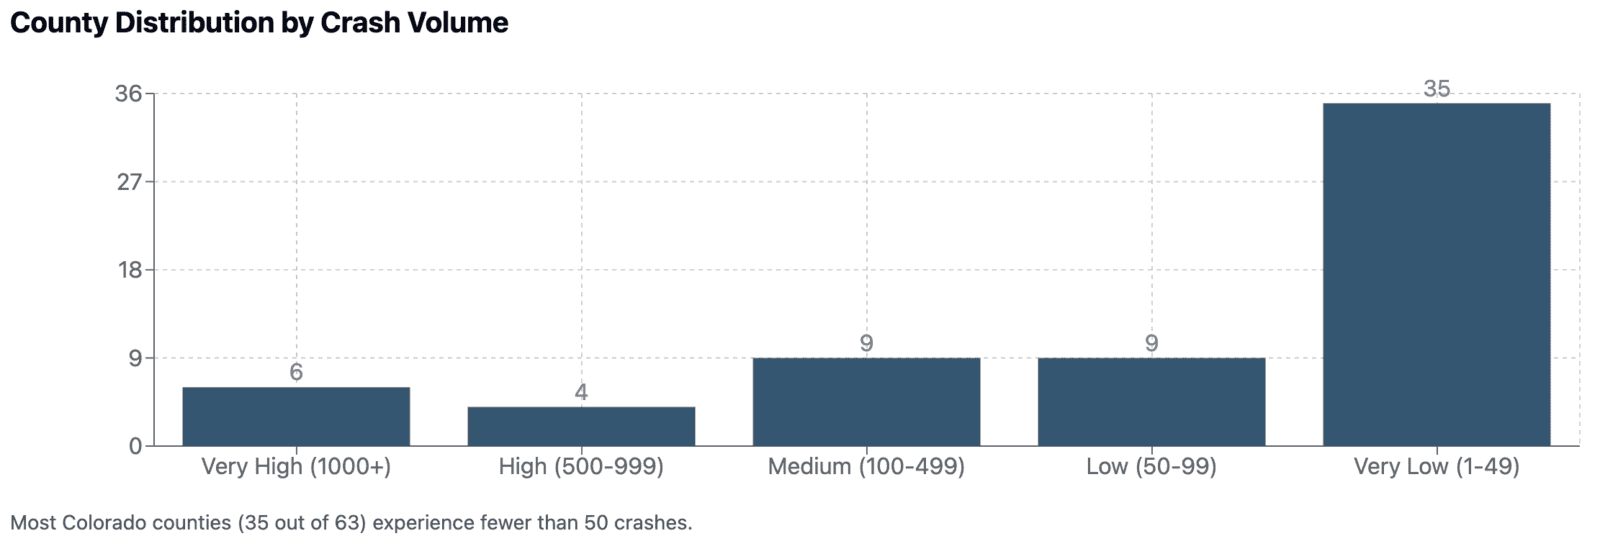
County Distribution
The data shows considerable variance in crash volumes:
- 5 counties report over 1,000 crashes
- 3 counties report between 500-999 crashes
- 7 counties report between 100-499 crashes
- 10 counties report between 50-99 crashes
- 39 counties report fewer than 50 crashes
Geographic Patterns
Front Range urban corridor counties (Denver to Fort Collins) show consistently high crash volumes. Mountain counties with major ski resorts and tourism (Summit, Eagle, Pitkin) display elevated crash numbers compared to other rural counties of similar size. Eastern Plains counties report the lowest crash volumes statewide, with Hinsdale County at the minimum with just 1 reported crash.
Fatal Crashes By Month
We broke down fatal crashes by month according to CDOT data. There have been a total of 63 fatal crashes resulting in 66 fatalities.
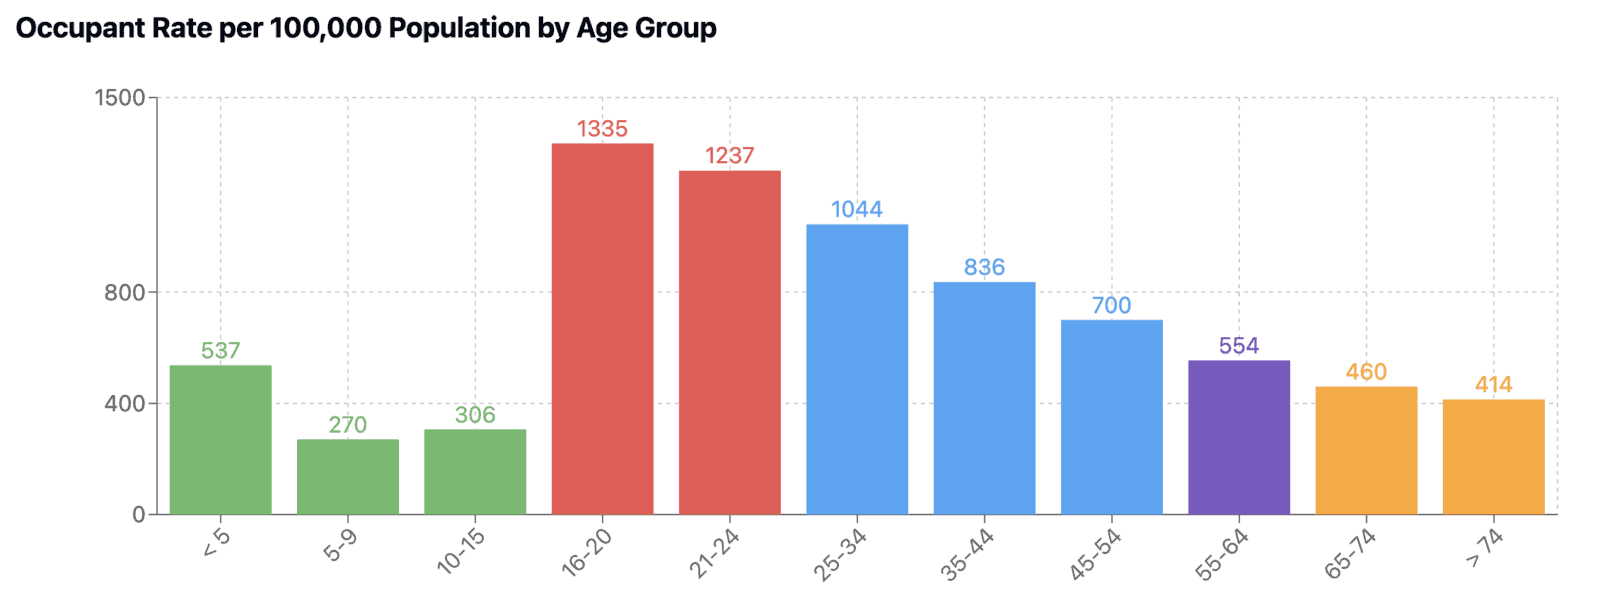
Colorado Crash Occupant Age Analysis
Understanding the age distribution of people involved in traffic crashes.
The age distribution data for vehicle crash occupants in Colorado reveals critical patterns about who is most affected by traffic incidents. This analysis provides valuable insights for targeted safety initiatives and resource allocation.
Key Insights
- Young Adult Risk: The 16-20 age group shows disproportionately high crash involvement relative to their population size, highlighting the increased risk associated with new drivers.
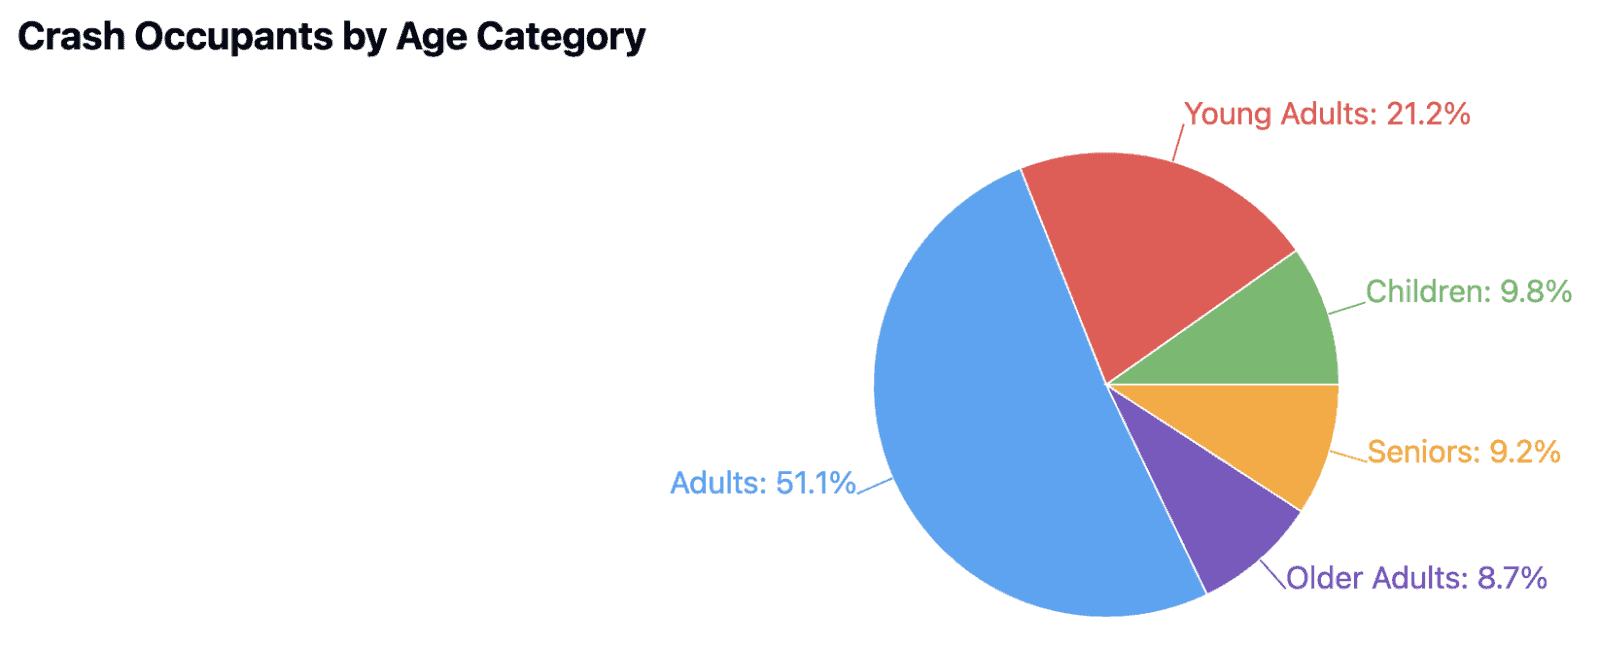
- Peak Risk Ages: Adults aged 25-34 account for the largest number of crash occupants (22.2%), reflecting both their driving frequency and potential risk factors.
- Vulnerable Populations: Children under 16 and seniors over 65 together represent 19.0% of crash occupants, highlighting the importance of safety measures for these groups.
- Population-Adjusted Risk: When normalized by population size, teenagers and young adults show substantially higher crash involvement rates than other age groups.
- Age Distribution: The data reveals a bell curve with peak involvement in early adulthood, dropping significantly in the senior years, partially due to decreased driving among older populations.
25-34
22.1% of total
Child & Senior
19% of total
Vulnerable Populations
Children under 16 (3,922 occupants) and seniors over 65 (3,676 occupants) together comprise about 19% of all crash occupants. These vulnerable groups often face higher injury severity when involved in crashes, highlighting the need for specialized safety measures like proper child restraints and considerations for senior mobility.
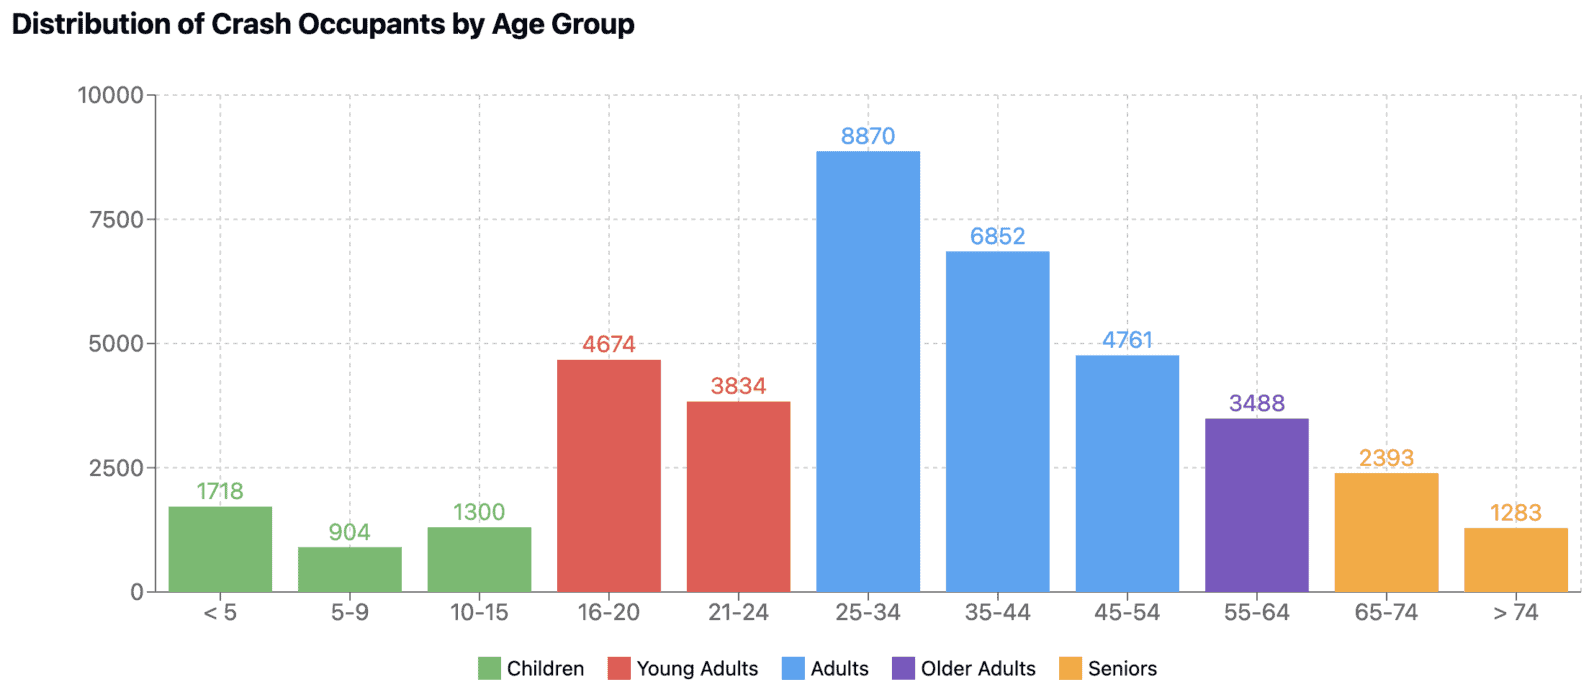
Age Group Distribution
The data shows a distinctive pattern across the lifespan. Young adults and working-age adults represent the majority of crash occupants, with the 25-34 age group experiencing the highest involvement at 8,870 occupants (22.2% of all crash occupants). This likely reflects their higher mobility, commuting patterns, and overall time spent on the road.
Working Age Impact
Adults aged 25-64 represent approximately 60% of all crash occupants (23,971 occupants), which aligns with their predominant presence on roadways for work commutes, family transportation, and other activities.
Age-Related Risk Factors
The data imply different risk factors across age groups:
- Young drivers (16-24): Inexperience, risk-taking behavior
- Adults (25-54): High exposure due to commuting and family transportation
- Older adults (55+): Potential physical vulnerabilities and slower reaction times
Road Safety in Colorado: The Complete Picture
After exploring Colorado’s crash data from Q1 2025, we’ve gained valuable insights into the patterns and risk factors that shape road safety across the state. Let’s synthesize what we’ve learned from our comprehensive analysis.
Time, Place, and Age: The Three Dimensions of Crash Risk
Our analysis revealed distinct patterns across three critical dimensions:
Time Patterns: Weekday afternoons between 3-6 PM consistently show the highest crash volumes, with Thursday at 4 PM representing the single most dangerous hour on Colorado roads. Morning commute hours (7-9 AM) also present significant risk, while early weekday mornings (2-5 AM) remain the safest time to drive.
Geographic Distribution: Crashes are heavily concentrated in urban areas, with just five counties (Denver, El Paso, Adams, Arapahoe, and Jefferson) accounting for over half of all crashes statewide. This urban concentration reflects the relationship between population density, traffic volume, and crash frequency.
Age Factors: Young adults face disproportionate risk, with drivers aged 16-20 showing significantly higher crash rates when adjusted for population. While the 25-34 age group has the highest raw number of crash involvements (22.2% of all occupants), teenagers have higher rates per capita, highlighting the dangers of inexperience and risk-taking behaviors.
The Intersection of Risk Factors
What makes this analysis particularly powerful is understanding how these factors interact:
- Urban Rush Hours: The combination of high-traffic urban areas during afternoon peak times creates Colorado’s highest-risk driving scenario
- Young Drivers in Metro Areas: Young adults navigating congested urban roadways during peak hours face compounded risk factors
- Vulnerable Road Users: Children and seniors involved in crashes, particularly in high-volume counties during peak hours, represent a critical safety concern
Looking Beyond the Numbers
While our data analysis provides valuable insights, it’s important to consider the human element behind these statistics. Each number represents real people affected by crashes—drivers, passengers, families, and communities.
The patterns we’ve identified can inform targeted interventions:
- Traffic Management: Focusing on enforcement and traffic flow improvements during Thursday and Wednesday peak hours
- Geographic Prioritization: Directing resources to high-crash urban corridors
- Demographic Outreach: Creating targeted safety campaigns for high-risk age groups
- Policy Development: Using data-driven approaches to develop effective safety regulations
The Road Ahead
As Colorado continues to grow and evolve, this crash data provides a roadmap for improving safety. By understanding when, where, and who is most at risk, policymakers, law enforcement, urban planners, and citizens can work together to create safer roads.
The insights from this analysis don’t just highlight problems—they illuminate solutions. Through targeted interventions based on these patterns, Colorado can work toward reducing crashes and creating a safer transportation system for everyone who travels its roads.
By addressing the specific risk factors identified in our analysis, we can move beyond simply responding to crashes and begin preventing them, ultimately saving lives and creating safer communities across the state.
If you are heading to Colorado, make sure you check our CDOT Real-Time Traffic Monitoring Tool to plan your trip and avoid unnecessary delays.